


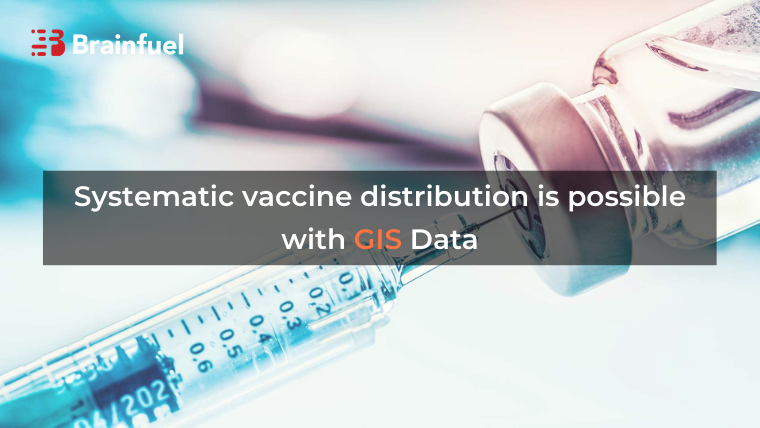
Part 1 – Systematic vaccine distribution is possible with GIS Data
The global pandemic has always loomed over our heads and to conquer the virus, vaccination has started. To take 10 Americans, one among them is vaccinated. But, it is impossible to accurately say the number of people to get vaccinated on account of different states and diverse plans for vaccine distribution. The great magnitude of logistical execution challenges can be sorted with the help of GIS development services.
The particular challenges are many like these. How will be the allocation for vaccination take place? How many doses of shot are needed for each state and each facility? How many health professionals do you need to execute the vaccination? How long will it take for the commute to get vaccinated? Another major challenge is the first attention must be delivered to the old citizens of the country. As usual, vaccination is provided at various places such as service centers, hospitals, state sites, and clinics. Though it is a complex process, the government is planning to have a retail pharmacy vaccination program using GIS development services.
We have seen situations like running out for shots as well as people wandering around to get vaccinated or voraciously looking for apps to get shots. This is a pathetic plight. Este Geraghty, Chief medical officer of a geographic information system at Esri has answered these challenges with the help of GIS development services. The geographic data helps conduct a successful vaccination program.
It is rocket science but the GIS development services make the whole process ease.
The Challenges
It is a global population going to get shots. How will you allocate shots for a day, week, or month? How many? At what time, the vaccination will be completed? At what pace do we do all of these? These are analytical and the outcome should be accurate as possible.
Organizations use GIS data and GIS development services for vaccination programs. The first group to be vaccinated is health allied professionals. And the Biden administration suggested that the goal was 100 million in 100 days. Vaccine allocation conduct based on the population of each state.
Let us take Georgia, when you look at it it is seen that there are considerable centers where people are fewer. Vaccination delivery in Georgia means 32,000 shots per day to vaccinate 100 million in 100 days. On the other hand, Atlanta has a great density of population that needs vaccination. At the same time, these states have cities or provinces with less populated and voluminous populations but not dense. These geographical problems have to be addressed immediately to conduct successful vaccination delivery.
Concisely, Getting the global population vaccinated, especially in the US is arduous and intricate in a short period. Let us understand how GIS data can sort out these issues in detail in the next blog.
About us
Urolime is one of the GIS development services in India. We offer fabulous services globally and have hands-on expertise in GIS technology. Integrate and map information is easy using our GIS development services in India.